





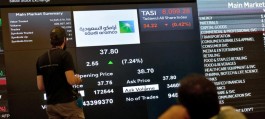


















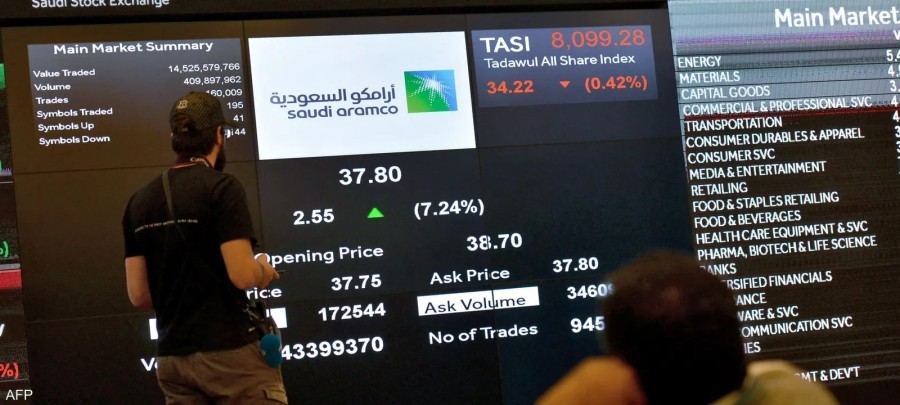


Analysis of the Saudi Aramco 5-hour chart reveals a strong downtrend with clear danger zones around SAR 25.36 . A break below this level could lead to further sharp declines. Despite oversold indicators, the trading environment remains very risky for those who jump in too early.
A scenario of a knife falling or a cautious recoil?
Saudi Aramco's recent movement on the 5-hour timeframe is characterized by a dominant downtrend. A 5-hour candle closing below 25.36 riyals would be a warning sign of further sharp declines, a break of the bottom that typically attracts panicked investors to exit quickly.
However, there are some signs of an attempt to build a short-term base: the Liquidity Index (MFI) at 19.81 shows excessive oversold conditions and exhausted sellers, with long lower wick candles at 25.36 indicating buyer intervention at the bottoms.
Trading opportunities: Profit and risk table
| Selling (prevailing trend) - aggressive | Sale - Reserved | Buying - Aggressive | Purchase - Conservative | |
|---|---|---|---|---|
| The scenario | Selling (prevailing trend) - aggressive | Sale - Reserved | Buying - Aggressive | Purchase - Conservative |
| entrance | 25.80 riyals (with a failure to break through the 20-period moving average) | 25.30 riyals (after closing below the bottom) | 25.55 SAR (Stability above VWAP) | 25.90 SAR (Closing above SMA(20)) |
| Stop loss | 26.05 riyals | 26.05 riyals | 25.30 riyals | 25.30 riyals |
| Goals | 25.30 / 24.84 / 24.50 | Same goals | 26.08 / 26.31 / 26.53 | Same goals |
| Risk-to-reward ratio | 2.0 / 3.84 / 5.2 | Same proportions | 2.12 / 3.04 / 3.92 | Same proportions |
| trust | High | High | weak | weak |
| Most suitable for | Trend follower | Patient and disciplined | An adventurer who is good at accepting losses | Speculators are waiting for clear stability. |
Note : Each scenario requires strict capital management discipline and avoidance of fluctuation zones (No-Trade Zone: 25.50–25.75).
Beyond the Numbers: Areas of Caution and Learning
The trend is stronger than the bounce signals! The downward trend is supported by the moving averages (SMA 20/50/200) above the price, and the Ichimoku cloud reinforces the idea of downward pressure.
Technical indicators warn: The trend strength indicator (ADX at 25.98) with clear negative control (-DI 36.33 > +DI 15.22), and the large trading volume on bearish candles suggest intensive liquidation operations.
Key takeaways: The presence of the hammer pattern at 25.36 may attract risk-takers, but unless the main resistance (25.84-26.12) is broken, the likelihood of a bounce is slim.
Summary of trading decisions
Higher risks: Entering the market before a confirmed rebound, or selling after a bottom collapse.
Selling preference: Within the 25.80–26.00 riyal range, while monitoring for any failed bounces.
Attention day trader: If the Money Flow Index (MFI) quickly exits oversold territory—a strong rebound is likely... but be careful not to fall into the bullish trap above 25.84 riyals.
Exit strategy: The possibility of achieving a break-even point or partial profits at the first target, then moving the stop loss to the appropriate point.
The most important lesson today
A single technical signal doesn't justify going against the trend. Even with impressive candlestick patterns or oversold conditions, the strength of the trend remains the primary driver; don't let greed lead you to ignore the market direction!