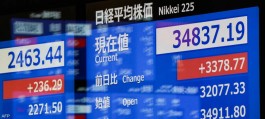
The Saudi market opened trading on Sunday with a sharp decline, losing more than 2%, following Donald Trump's decision to impose additional 100% tariffs on China following its increase in trade controls on rare earth exports. The Saudi market erased the gains of the past eight sessions and fell to 11,331.11 points.
In the minutes following the opening bell, Saudi stocks attempted to rebound and cut losses, successfully reducing losses from 2% to 1.66% at 10:06. The market witnessed collective declines, with leading stocks falling, with Aramco falling 1.7%, Al Rajhi Bank dropping 2.8%, and SABIC falling 1.48%.
Technical analysis summary for the TASI index
Final Signal: The TASI is showing mixed signals, but the overall bias is cautious with some signs of strength — RSI at 58.5 (buy), MACD positive (buy), but short moving averages are pointing to sell .
Strength signals: RSI and MACD
RSI at 58.5 : This reading is in the upper neutral zone, indicating continued upward momentum without entering overbought territory. Typically, RSI levels between 50 and 70 indicate a moderately strong market, but not overbought.
MACD at 184.19 (Action: Buy) : This is additional support for positive momentum, and typically indicates the beginning of an uptrend or the continuation of an existing uptrend.
Cautionary signals: moving averages
Simple Moving Averages (SMA):
SMA5 and SMA10: Sell
SMA20, SMA50, and SMA100: Buy
SMA200: Sell
Exponential Moving Averages (EMA)
EMA5 and EMA10: Sell
EMA20, EMA50, EMA100, EMA200: Buy
The message here: Short-term averages indicate a temporary correction or weakness, while longer-term averages remain supportive of the uptrend — the market may be in a reconsolidation phase before a new attempt to rise.
Combination: Uptrend with a pause
- RSI and MACD support the upward trend.
- Short-term averages (5 and 10) indicate a temporary decline.
- Medium and long-term averages support the uptrend.
Conclusion: The market is neither in a pure bullish nor a sharp bearish trend—it is in a volatility phase with a slight positive bias, but any break below the longer moving averages could change the picture.


