




































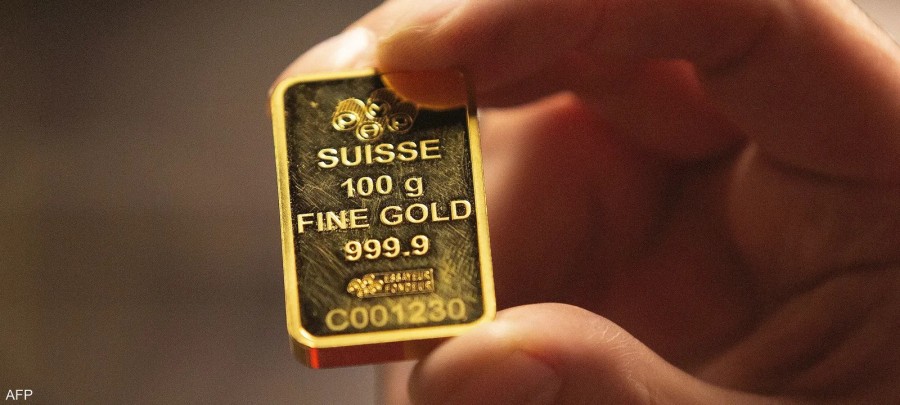


Gold is currently trading at $4,184.88 per ounce (spot XAU/USD), down about $9.36 (-0.22%) from Friday's implied spot close near $4,194.24. This comes as Europe opened higher and Dow futures rose 139 points, in a week that sees the closure of Tokyo and the US bond markets. Today's headline news for gold is the thin liquidity, anticipation of bank earnings reports on Tuesday, US September inflation figures on Wednesday, and Iran's response. Gold ended last week with a gain of about 1.29% (approximately $383 billion in paper market value) compared to $4,140.68.
Futures (December): $4,208.85 (-7.45, -0.18%), with a carry difference of about $24 from the spot price.
Silver: $61.188 (+0.139, +0.23%), with a gold-to-silver ratio of approximately 68.4. Other precious metals are also rising: platinum at $1,705.30 (+0.58%) and palladium at $1,159.25 (+0.80%).
Oil: Brent at $104.37 (-0.33%) and WTI at $91.27 (-0.63%), after being up about 1% at 1:30 AM, then falling more than 1.2%, with the US-Russia deal in the forefront.
Other commodities: Copper 6.7448 (+0.52%), Natural Gas 3.162 (-1.19%).
The dollar was almost unchanged at 1:30 AM (EUR/USD 1.1199 and USD/JPY 158.32), after its index finished last week near 102.08.
Gold news today
A quiet opening with thin liquidity. Gold begins the week slightly lower (-0.22% at 4,184.88), while European stock markets rise (DAX +0.44%, CAC +0.52%, and FTSE +0.36% in futures contracts) and Dow futures +139 points, after a week in which it climbed from a two-month low (4,082.90) to near 4,199. Tokyo is closed for Sports Day and the US Treasury market is closed for Columbus Day, while stocks are trading, meaning the 10-year yield will not provide a signal today, and news activity may be amplified in the thin liquidity.
Inflation Week. On Wednesday, October 14, September inflation data will be released at 12:30 GMT (3:30 PM Saudi time), the last reading before the Federal Reserve meeting on October 27-28. August inflation was 0.4% month-on-month and 3.4% year-on-year (core 0.3% and 2.4%). One source forecasts 0.6% month-on-month for September, which would push the annual rate up to around 3.7%, though no consensus has yet been published. Analysts at Kitco believe the reading could give bears renewed confidence if inflation remains sticky with rising energy prices, and that significantly higher-than-expected data would be needed to force the Fed to raise rates this month.
Banks then Warsh. On Tuesday, the results from JPMorgan, Goldman Sachs, Wells Fargo, and Citigroup begin, on Thursday, producer prices and retail sales, and on Friday, Federal Reserve Chairman Kevin Warsh speaks in Bangkok around 7:30 a.m. Saudi time, his last appearance before the silence period preceding the meeting.
Kitco Survey. According to Kitco's weekly survey (October 9), 7 of 14 Wall Street analysts (50%) predicted gold would rise this week, 2 (14%) predicted it would fall, and 5 (36%) predicted it would fluctuate sideways. Among 206 individual investors, 45% predicted an increase, 37% a decrease, and 18% predicted it would remain stable. Darren Newsome (Barchart) predicted an increase, while other analysts believe gold needs a sustained return above $4,200 before investors will make a strong comeback, and that the medium-term outlook remains bearish due to the December price hike.
Oil and Iran. Brent (104.37) and WTI (91.27) fell after rising earlier in the day, following Trump's announcement on Friday of a diesel deal and a ceasefire in the energy sector between Russia and Ukraine. Tehran is awaiting Washington's response to its proposal to reopen the Strait of Hormuz within seven days. Trump stated that Russia and Ukraine had agreed to an immediate ceasefire in the energy sector after the Russian diesel deal, both factors putting downward pressure on fuel prices. The rise in oil prices is fueling concerns about inflation and yields, while the tension is supporting gold as a safe haven.
Sovereign demand. The People's Bank of China added 23 tons in September, marking the 23rd consecutive month of purchases, and net central bank purchases totaled 39 tons in August, according to the World Gold Council.
Technical Analysis (WarrenAI, 30-minute timeframe, 1:43 AM)
Gold at a crossroads
XAU/USD is trading at $4,188.22 (-0.14%) according to WarrenAI. The short-term picture is neutral with a slight downward bias , as the price is stuck between resistance at 4,200 and support at 4,174. It is above the SMA(200) at 4,145.00, so the broader trend is supported, but it is below the SMA(20) at 4,190.06, meaning that buyers have lost some short-term control.
Levels:
First resistance: 4,190-4,201, where the SMA(20) clusters at 4,190.06 and the upper Bollinger Band near 4,201.04.
Crucial resistance: 4,207.51, the last local high.
First support: 4,174.28 at SuperTrend.
Structural support: 4,167.19-4,145.00, near the bottom of the cloud and SMA(200).
Momentum cools: MACD at 3.70 against the signal of 4.98, i.e., a bearish crossover, and a Doji candle near 4,188.11 reflects the hesitation, and the possibility of a double top near 4,207.51 is only confirmed by a clear break below 4,174.
Conditional scenarios
Aggressive bearish scenario: Entry near 4,188 with continued MACD weakness, stop loss at 4,200, targets at 4,164 then 4,145, ratio 2.0:1 then 3.58:1. Moderate confidence. For an active trader.
Conservative bearish outlook: After a 30-minute close below 4,174, stop loss at 4,207, targets at 4,145 and then 4,137. Moderate confidence, the ratio is calculated after confirmation.
Aggressive bullish scenario: Above 4,190 with price stability, stop loss at 4,179.90, targets at 4,207 then 4,245, with a ratio of approximately 1.53:1 then 4.86:1. Moderate confidence, MACD needs improvement.
Conservative bullish outlook: After breaking through 4,207.51, stop loss at 4,190, targets at 4,245 and then 4,295. Moderate confidence, the ratio depends on the execution price.
We reviewed the announced ratios: 2.0:1 and 3.58:1 apply to an entry at 4,188 and a stop loss at 4,200, while the ratios for the aggressive bullish scenario apply to an entry near 4,191 (around 1.5:1 and 4.9:1). The area between 4,175 and 4,194 appears to be a fluctuating range with no strong advantage, according to the analysis.
What changes the image?
Bullish signal: A 30-minute close above 4,207.51 with an improving MACD, extending the move towards 4,245.84.
Bearish signal: A break below 4,174.28 followed by a failure to return above it opens the way towards 4,145.00 and possibly 4,137.04.
The two dividing levels: 4,207.51 upwards and 4,174.28 downwards.
What we monitor
Today: No yield signal (bond market closed), oil movement and Iran news.
Tuesday, October 13: Results of major banks.
Wednesday, October 14: September inflation, which is the most important stimulus.
Thursday, October 15: Producer prices and retail sales.
Friday, October 16: Workshops in Bangkok.
Daily Summary
Gold is trading at $4,185, between resistance at $4,200 and support at $4,174, with a quiet opening amid increased risk appetite and a decline in oil prices. Key market events remain Wednesday's inflation figures and Iran's response. The key levels are $4,207.51 on the upside and $4,174.28 on the downside.