


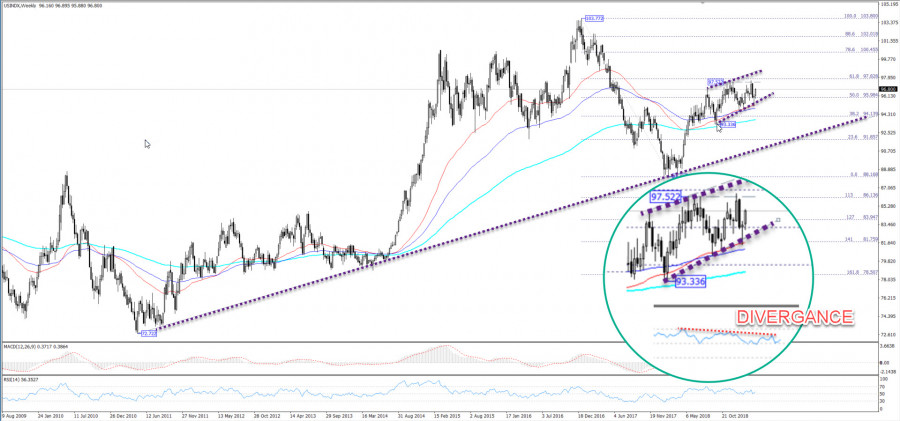


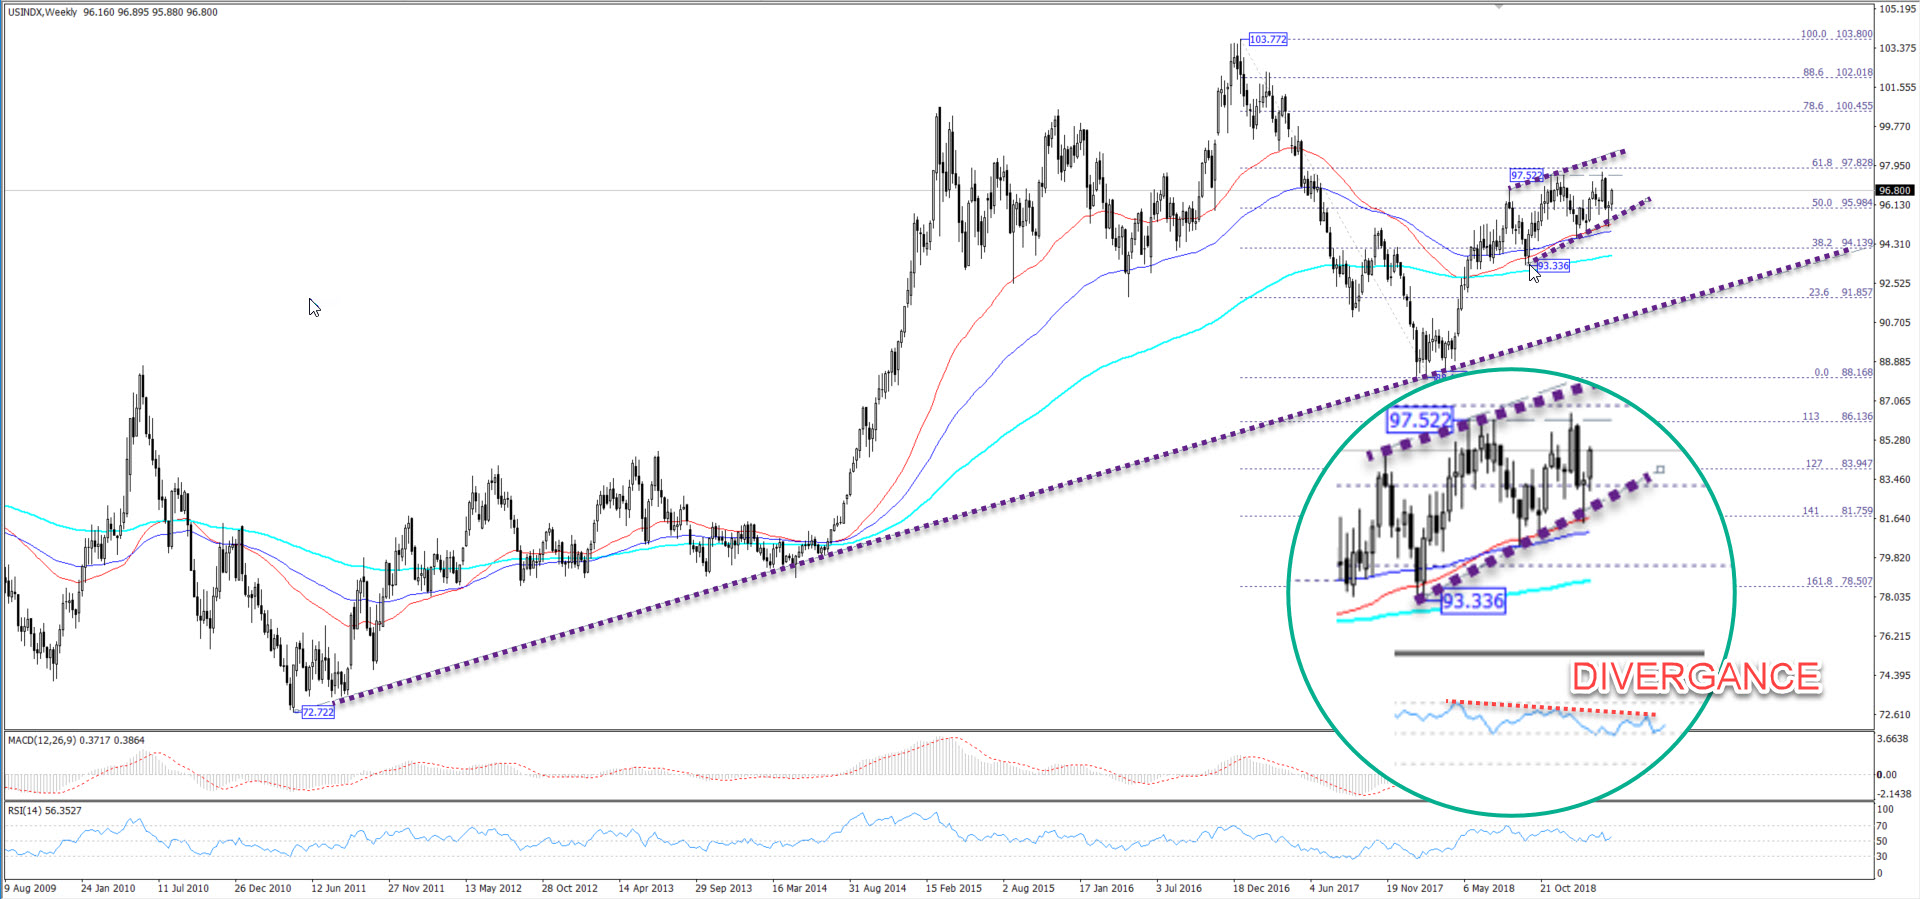
The dollar index bounced from the lower boundary of the triangle to keep trading positive above the Fibonacci 50 for the downside wave 103.77 88.14 and the bulls are trying to reach the resistance 97.52 and succeeding in surpassing it. These levels are to end this climb.
The drop directly and broke the bottom 94.65 ends the upside move for the index to go to 38.2 levels at 94.14, but the outlook remains positive as long as trading is above the strong weekly trend from the bottom 72.72 and is currently at 91.85.
We have a negative divergence on the indicators confirming the weakness of the current upside trend so far, and on the other hand, the RSI index remains stable above the 50 line.
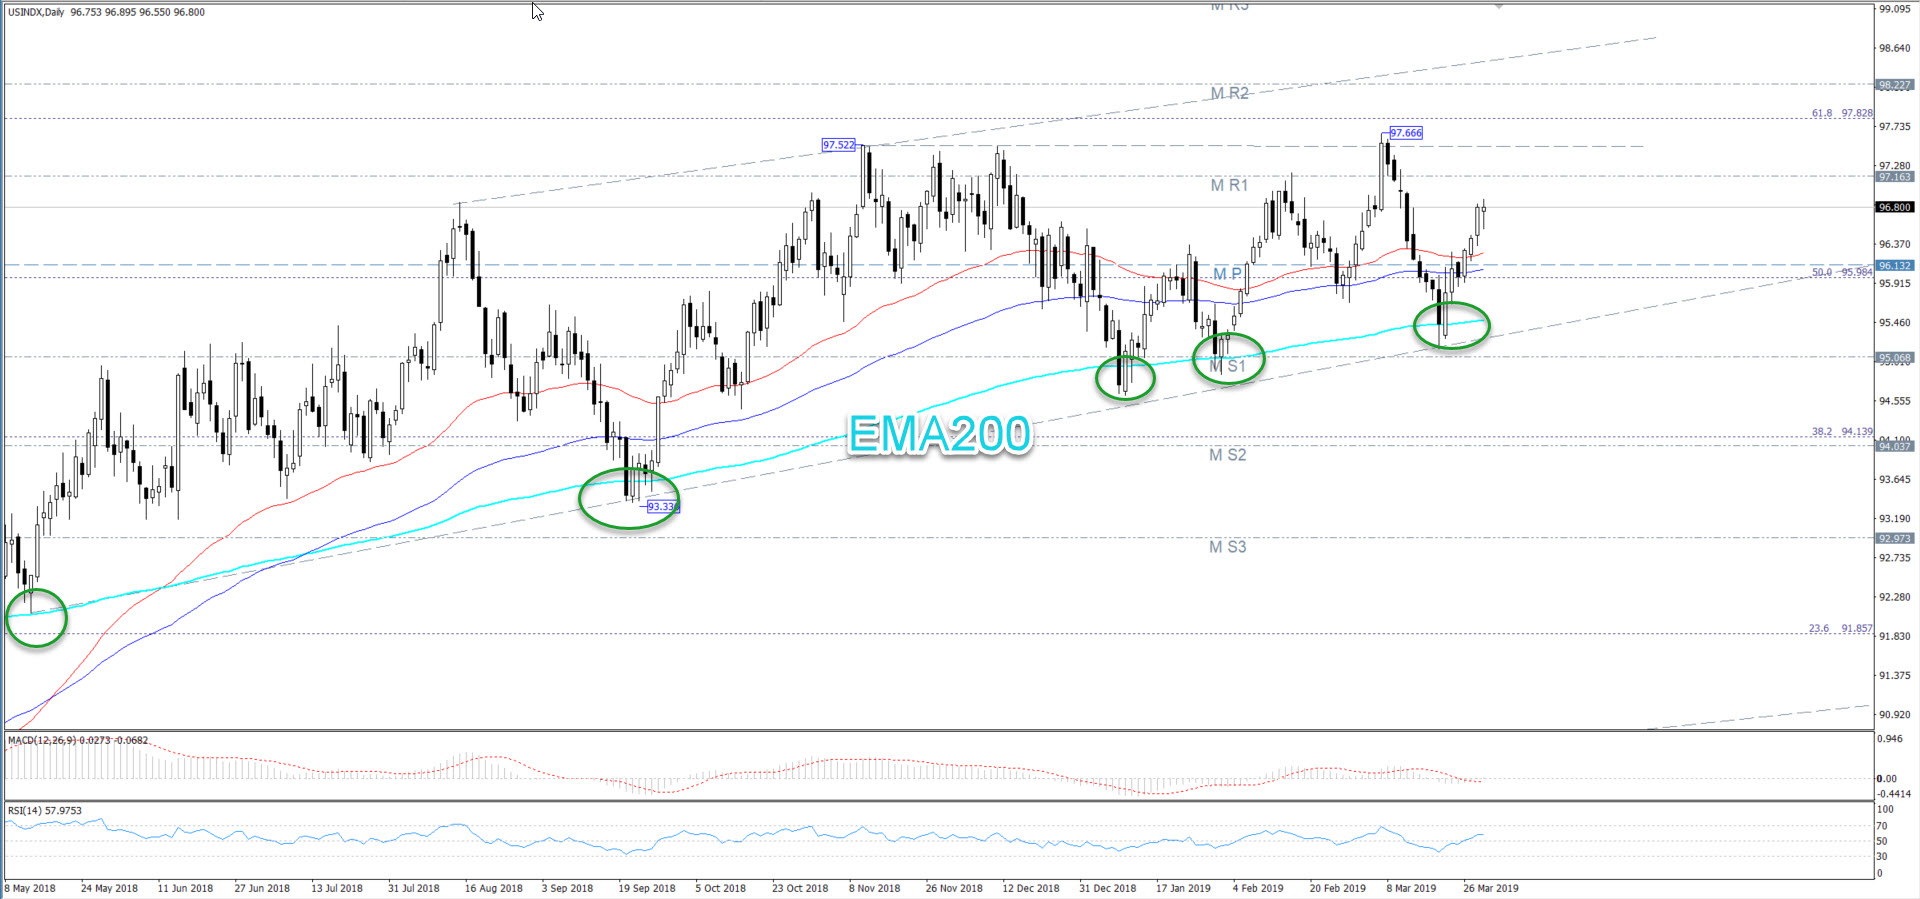
Looking at the daily chart, the index bounced from the 200th exponential average for the fifth time to remain strong support for buyers, breaching the level 97.52 is important for bulls to target the R2 and the price of 98.22.
Support Levels: 96.10 95.70 9510 Resistance Levels: 97.16 97.52 98.22