


We had previously published an analysis of Saudi Sadiq shares through this link
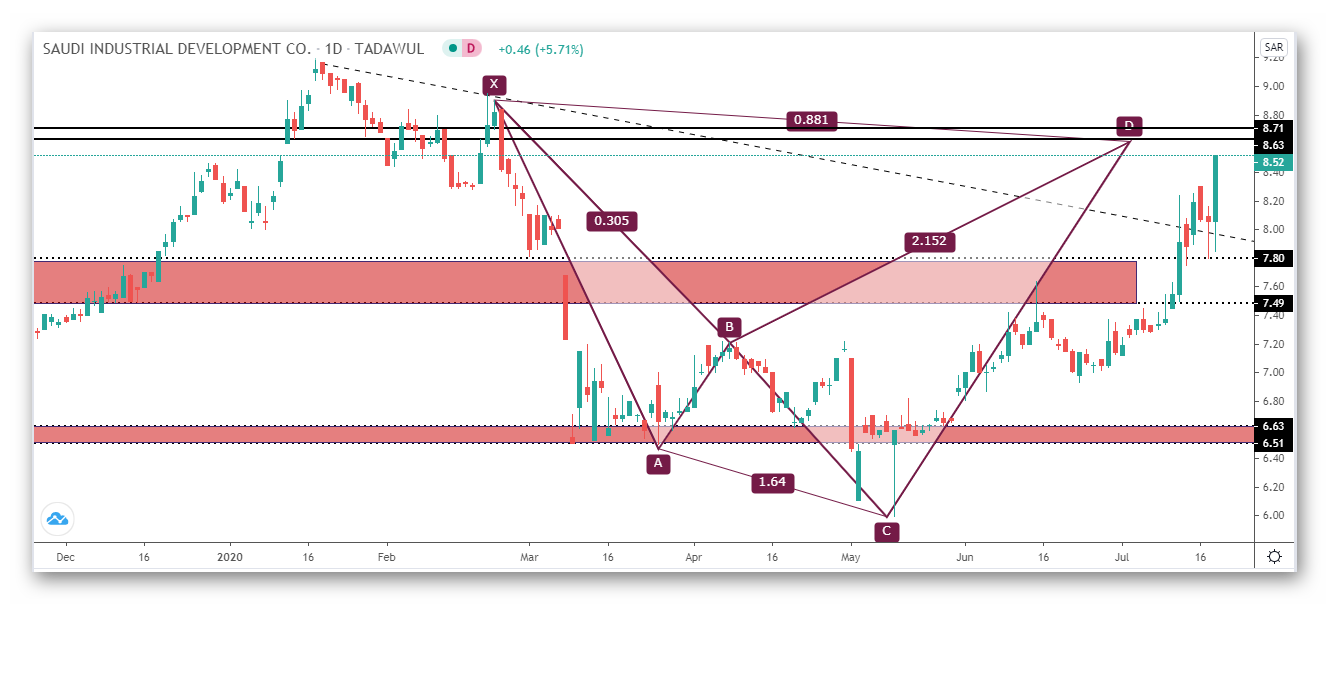
The stock rose from the support area 6.50-6.65 and then faced the resistance area at 7.50-7.80
levels
Indeed, the price was able to break it to ignore the falling trend that reached from the top of last January, and then to target the expected harmonic pattern shark with a correction of 88% Fibonacci retracement of the rib xa at 8.65-8.70
To achieve all goals