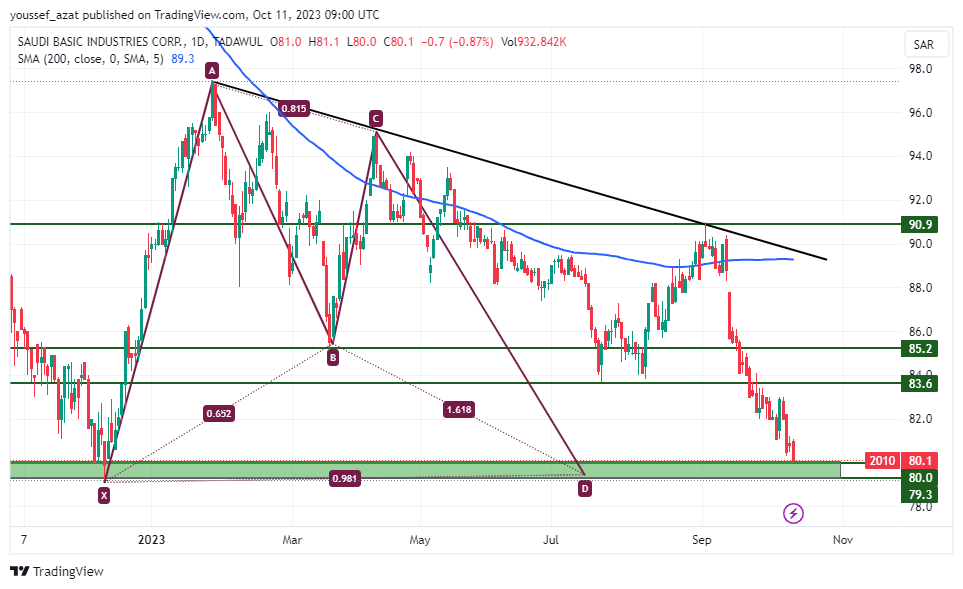


Current price: 79.8
Key point: 80
Our preferred direction: buy positions above the 80 levels, targeting 83.6 as the first target, then 85.2 as the second target.
Alternative scenario: stop loss and change the trend by breaking the 80 level, targeting 79.00 levels
Technical commentary
SABIC stock, code number 2010, is moving in a downward direction on the daily frame from the peak of this month, breaching several pivotal support levels.
The stock is approaching strong support levels, which are last year's bottom at the levels of 79.3-80.00, consistent with the Harmonic BAT pattern with an 88% Fibonacci retracement of the xa leg.
It is expected that if the price forms bullish price behavior, it will head towards the next resistance levels 83.6-85.2.