


Elliott wave – the ultimate guide for a forex trader!
Are you looking for a trading method that can help you look into the future! Stick around and I will show you how the Elliott Wave model proposes just that, and how to apply Elliott Wave to your trading, successfully and profitably.
In the article below I hope to lay out everything the forex trader needs to know about Elliot Wave Theory.
This piece is full of useful applications of the famous trading method.
Here you will learn:
1. What the Elliot Wave model is.
2. How to recognise the trending markets using Elliott Wave.
3. How to recognise corrections within the trending markets.
4. How to use Elliot Wave to define the trend change.
5. How to recognise correction forms ( Zig-Zags and Triangles)
I will explain Elliot Wave theory on real examples and I will lay out in a step by step fashion how Elliott wave can:
· improve your trade entry,
· tighten up your money management
· and increase your profitability.
Most forex traders ask themselves a thousand questions every single day, while trying to figure out what to do next.

What decision will the fed make?
What direction is the economy going?
and so on and on !
Most of these type of questions are a waste of time
And the answers don’t offer you any information of any use!
What questions do we need to be asking? And. What information is ACTUALLY important?
Here are four incredibly important questions that a forex trader needs to ask and, that Elliott wave can help you answer.
· What direction the price is trending
· How far is this trend likely to go
· Where can I enter a trade with the best risk reward ratio
· At what point am I definitely wrong?!!!!!!!!!!
1.The Elliott Wave model:

The Elliott wave principle offers traders a model for the likely path of prices.
The Elliott wave model says that the price will trace out five ‘waves’ in the direction of the trend and then will correct in three waves against the trend. This knowledge is very useful because:
If you know the likely trend, then you know how you should position your trade

he wave principle was introduced by R.N Elliott in the late 1930’s. he was a professional accountant and avid market technician.
The Elliott Wave Principle proposes that collective investor psychology, or crowd psychology, swings from optimism to pessimism naturally. These mood swings create patterns that appear in the price movements of markets. These movements can be tracked in real-time and, with practice, can be leveraged to make predictions of future market movements with the help of Elliot Wave Rules & Guideline of discovered 11 wave patterns.
The wave principle has enjoyed a resurgence over the last decade, through the work of Robert Prechter and his firm ‘Elliott wave international’ which can be found at Elliottwave.com.
 The story of Robert Prechter’s 444% return in the 1984 United States national trading championships is now almost legendary.
In 1979 Prechter left Merrill Lynch and published the first subscription issue of the Elliott Wave Theorist.
The 1970s had been very bullish years in the gold market but mostly bearish for stocks, yet his Elliott wave analysis called for a long-term reversal lower in gold (February 1980)
Prechters nearest challenger made 84%. He did not use magic or tricks he maintains he simply applied the wave principle to the letter and caught several moves in that 4 month period, using Dow futures as his trading vehicle.
2.What direction the price is trending?
The beauty of the Elliott wave model is that not only can it give you a view on the trend direction.
It also offers insight into the trend maturity. So: If you know the trend direction. And you know the trend is early in its maturity.
Then you can be happy leaving a position open for longer and following that move untill its likely conclusion.
How far is the trend likely to go?
Whether it is an impulsive move in the direction of the trend which is in 5 separate waves. Or a corrective move against the trend, the Elliott wave model offers a gauge as to how far the move is likely to travel.
How does it do that? Lets break it down, shall we.
A trend move.

The model proposes that the trend unfolds in 5 waves in the direction and 3 against.
The internal make up of each wave should also unfold in 5 waves. This feature allows the Elliott wave trader to follow the wave and count it as it is happening in real time.
If you have counted wave (1) up ;then you could expect a correction in wave(2).
This action can all but confirm a wave count and you can get ready to enter your long position.
When your position is on, you can then count the waves as they happen, wave (3) will move higher usually in a larger move in points than wave (1).
then watch wave (4) correct downwards, but it should not violate the high of (1) and then a final push up in wave (5). which should again trace out 5 waves.
All along you hold your position open untill the waves are complete.
Following the waves improves your entry position, and improves your exit point, bagging you more points in the process.
3.Corrections:
The opposite is true for a correction.
A correction will unfold in three waves labelled A,B,C.
Counting the waves again allows the trader to trace the correction as it happens. Keeping on top of the wave count will give you the best opportunity to ride the price correction to its completion in terms of the waves.
Bagging the points and ridding you of uncertainty.
Trade setup using Elliot wave theory.
The next question is:
Where can I enter a trade with the best risk reward ratio? This involves 3 points of confirmation. Almost like the start of a race!
On your marks!

First thing first,
There is no point in the world of trying to catch the exact bottom or top of any trend change.
You may as well be trying to catch a falling knife!
Elliott wave traders are always looking for ‘confirming price action’
That is price action that has the ‘right look’.
What the hell is the ‘right look’ then?!!!!!!!!!!!!
By this I mean, we have to able to count 5 waves in the direction of the trend, and three waves against the trend.
These waves can be labelled as above.
Then:
Once the price action has reached the end of its wave (2) correction we can look higher in wave (3).
Get set!

When the market is set up, with the 5/3 wave count in place, we begin to look for the market to turn back in the direction of the main trend.
If this happens, it adds a significant weight of confidence to our wave count.
We can then say that we have confirming price action. But we don’t enter just yet!
Go!

Our Go point is triggered when the price moves past the end of minor wave ‘b’ within the correction.
When this happens, It is go time!
As the confidence level is now at its highest, and price has resumed the trend.
3.How do I know if I am wrong?The trend change

This is where your PROTECTIVE STOPS come into their own.
There are 2 rules that cannot be violated within the Elliott wave model.
Wave 2 cannot retrace more than wave 1.
Wave 4 cannot enter the price territory of wave 1.
These are the positions at which we place our protective stops.
Once our trade is placed. We immediately check these rules and place our protective stops accordingly.
We can eliminate much of the confusion and angst by applying these rules and we also minimise our losses to a known amount which allows us to trade another day!
Lets jump a bit deeper in to the different types of Wave forms.
There are 2 main categories of wave form.
MOTIVE waves.
CORRECTIVE waves.
Motive waves get the market places, these are the trend waves broken into 5 separate moves.
Corrective waves are usually in 3 moves, tend to overlap and make less progress than motive waves.
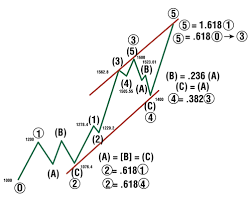
The motive wave form.

You can see above the overall wave form.
Price projections can be inferred from the length of wave 1.
lets see the wave form in action.

Above is a chart of EURUSD in hourly bars.
The complete wave form traces out 5 waves up and 3 waves down over a period of 6 weeks.
The price went from 10530 at the wave 1 low to 11470 at the wave 5 high. A move of 940 points.
Following an Elliott wave trade example.
You could enter a trade at the GO point illustrated above, at about 10770. this is where the price moves above the wave ‘b’ of the minor correction giving a buy signal.
A protective stop would be placed at the wave 2 low risking about 130 points.
Then using a trailing stops method we could net about 550 points overall.
5.Corrective waves.
There are 3 main types of correction waves, Zig Zag’s, Flats and Triangles.
The zig zag form:

The zig zag correction is the simplest and easiest corrective form to track.
It unfolds in a 5/3/5 manner 5 waves in A, 3 in B and 5 in C as shown above.
Both the A wave and the C wave tend to be the same length in points.
Also the whole wave form tends to fit in a trend channels quite neatly (shown in blue).
Lets look at a real time example.
This is a magnified picture of the 3 wave correction off the high in the previous example.

The above example is a perfect realtime example.
In a zig zag correction we expect to see wave ‘a’ unfold in 5 waves – got it.
wave ‘b’ trace out 3 waves – got it again.
and then wave ‘c’ complete another 5 waves down, perfect form!
Wave ‘a’ down totaled 400 points.
And wave ‘c’ came to 405 points.
Almost perfect equality!
And to top it off:
The whole structure fits in a beautiful parallel trend channel!
Using the guidelines of the Elliott wave model we could also trade this structure with a high degree of confidence.
Waiting for wave ‘a’ down to complete in 5 waves, we watch for a three wave correction.
And once we get it, we can enter on the short side expecting a downward move of similar points distance as wave ‘a’.
in this case it was about 400 points!
Thats two successful Elliott wave trades in the space of 6 weeks, netting 950 points in total!
Some other corrective forms.
The flat correction:

There are 2 types of flat correction, the regular flat and the expanded flat.
Both race out an internal wave structure of 3-3-5 waves.
The expanded version has a ‘b’ wave which travels beyond the start of wave ‘a’ and a ‘c’ wave which travels beyond the end of wave ‘a’ thereby expanding the travel.
Lets look at a real-time example.

While flat corrections are notoriously hard to follow as they unfold, when it resolves, it seems to paint a complete picture.
And when the correction completes.
You are in a position to make a very high confidence call on the future direction of the market.
Triangles:
The form of the triangle which occurs the most is the contracting triangle.
Triangles are a pause in the trend.
It is almost as if steam is being built up in the market.
Only to explode in the direction of the trend when it concludes.
A triangle looks like this.

The triangle will have 5 internal waves, each wave made up of 3 distinct moves.
Each separate wave will complete within the range of the previous wave.
As the wave completes, it leads us to a surer outcome and a tighter stop-loss.
An Elliott wave trader can use the concluding wave of the triangle as an entry point.
As shown above. The triangle offers unique risk reward ratio among waves.
Lets check out some real world triangles.


Notice the power of the move after the triangle is complete. it seems to explode away from the end of the triangle.
These are powerful moves to catch.
Elliot Wave Rules & Guideline for the 11 wave patterns.


This is Just the beginning with a lot of training and experience you will be able to distinguish this wave patterns and get better result on your trade
Conclusions.
The aim of a trading strategy is to identify market turning points, either highs for selling or lows for buying.
It’s that simple.
The most attractive characteristic of the Elliott wave model is that it provides an objective method to view the market.
It does not involve itself in news or events.
The Elliott wave model says that the market is going to do what the market is going to do!
The beauty is:
If you can discern an Elliott wave pattern within the often chaotic madness of the price action, you can make a clear judgement on what should happen next.
And exactly where you are wrong.
And that knowledge is priceless.