


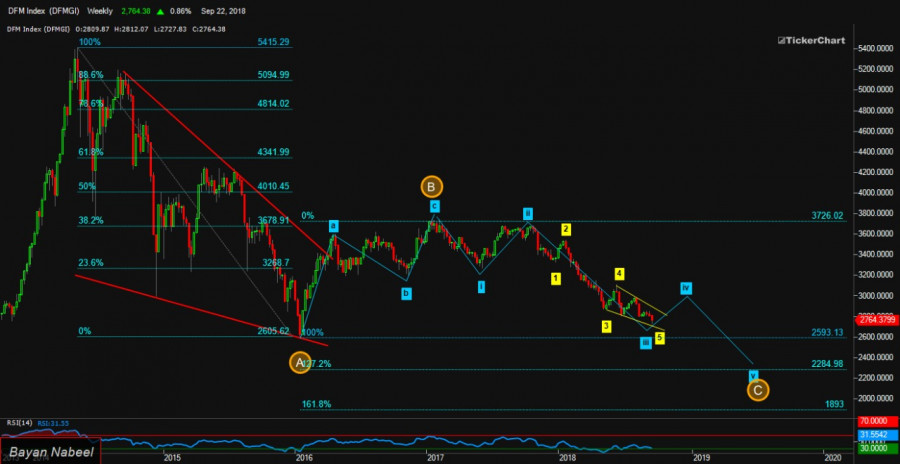


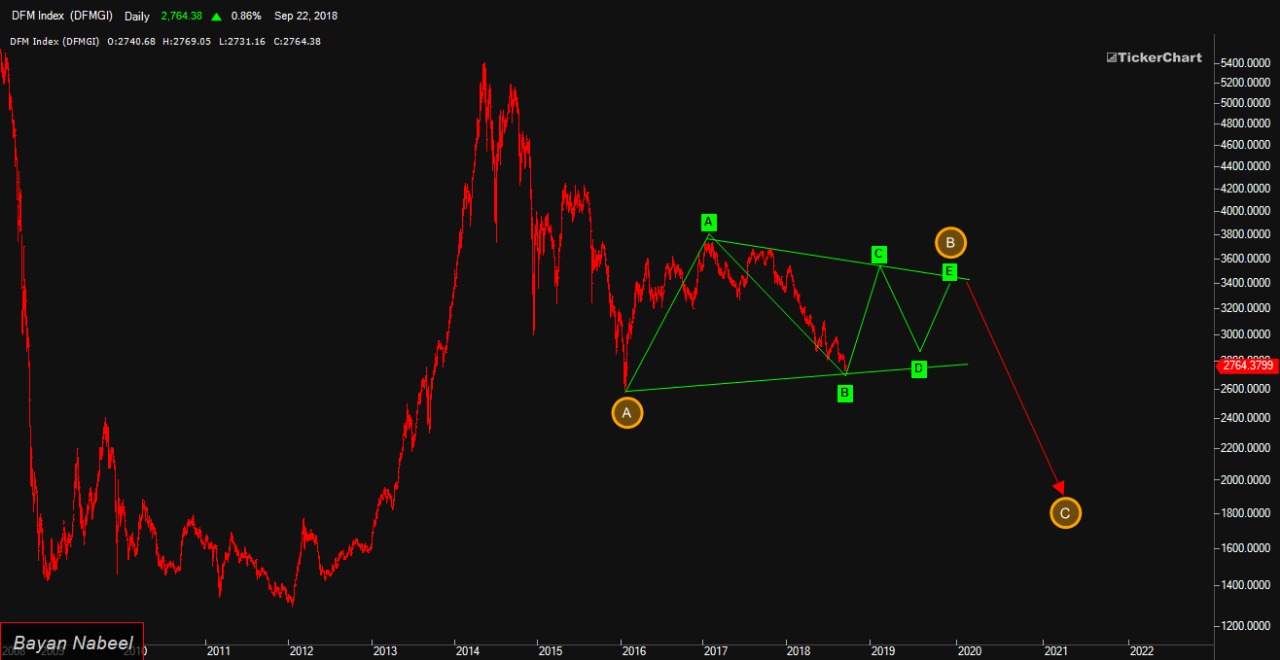
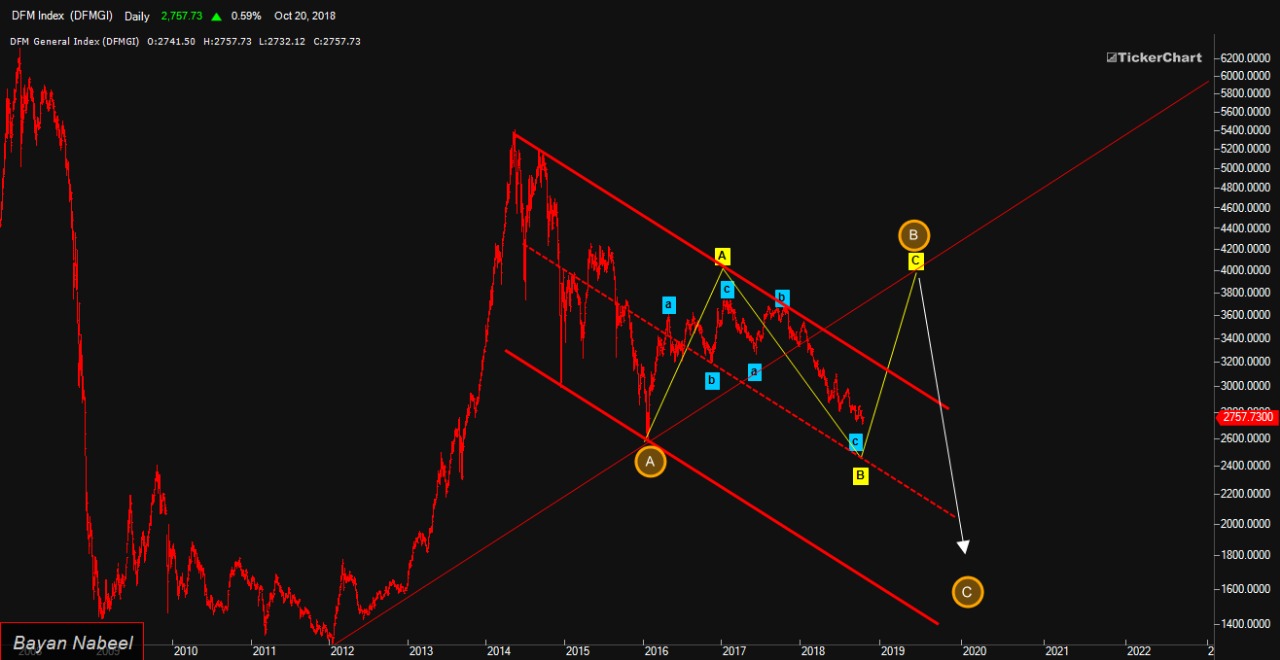
There is more than one scenario for the expected movement of the index over the next three years, the worst of which is the first scenario, while the best one is in yellow, and it is more complicated and fluctuating in green .. But all share that the market did not finish forming a final bottom for the following years and will return to achieve the bottom later in the long run before To enter another period of sleep and then enter a new bull market.
According to what we see in the drawings, the three graphics also share a near formation of a rebound from the current area near the bottom of 2590 a little higher or a little lower ... and the current movement may continue until the end of the first quarter of next year, especially if we take the first scenario to approach the levels of 3000-3100 or even Near 3250
This coincides with the movement of global markets for the coming period .. If we take the American markets as an example ... the year 2019 is the third year in a presidential session which is usually the best pre-election performance years and given that global markets are near the formation of historical peaks for a future period according to my humble view ... and this formation usually takes time and high volatility before confirming that it has entered a bearish session, as this volatility will allow the Dubai market to move mentioned.
If we look at more depth as a unique movement, the Dubai market may precede the rest of the markets in giving the signals of a rally, similar to what I indicated to him from the movement in July 2017.
At the level of numbers
Short movement, resistance 2853 opens the range for medium range at 3100-3000.
Long term 3333 resistance open the range up.
While supporting the short movement 2660 and 2016 bottom at 2590 of course. Breaking this support by closing the week opens the way for support 2313-2273
The closest is currently not breaking the average numbers and starting a technical bounce, either immediately or after another drop of the aforementioned wedge rib and forming the fifth wave of it.
I remember that the previous analyzes are a view of the general movement for the coming medium and long term and not for the daily trading
Our best wishes for everyone success.