


assessing any market accurately will not be easy to reach, and if it resorted The investor has to compare between one market and another by studying the extent of the market’s attachment to the source of interest in another market or a specific investment asset. It may reach a mutual effect or correlation between the two markets or the original. This correlation may be positive or negative. The changes that occur on oil prices on the one hand and their correlation with the changes that occur on the Dubai Financial Market Index during the past fifteen years, we may reach a number close to 28%, which indicates that this Even if the correlation was positive but it is weak and not fit to be taken into account if we want to evaluate the performance of the Dubai Financial Market
The same applies if we decide to search for the relationship between the market, the source of interest, and other major markets. In both cases, we will arrive at different results despite our conviction that the chosen variables have more weight and significance than the statistics show. Here we thought about studying all the variables that may have a specific impact or correlation on the performance of the Dubai Financial Market, and we saw that we combine all these changes together and reduce them with only one indicator we called it the golden ratio. This proposed indicator, which will remain under trial and development, includes a comparison between the performance of the Dubai Financial Market and the performance of both: Abu Dhabi Financial Market, the Saudi market, Brent crude prices, the performance of the American Dow Jones and gold prices, all these variables have been studied and combined together according to levels of importance and historical correlation With the Dubai Financial Market Index and we ended up with one cumulative ratio, the golden ratio, which gives us a common vision about the current evaluation or comparison between the Dubai Financial Market and the evaluation of markets and investment assets that we saw had a certain impact on the market.
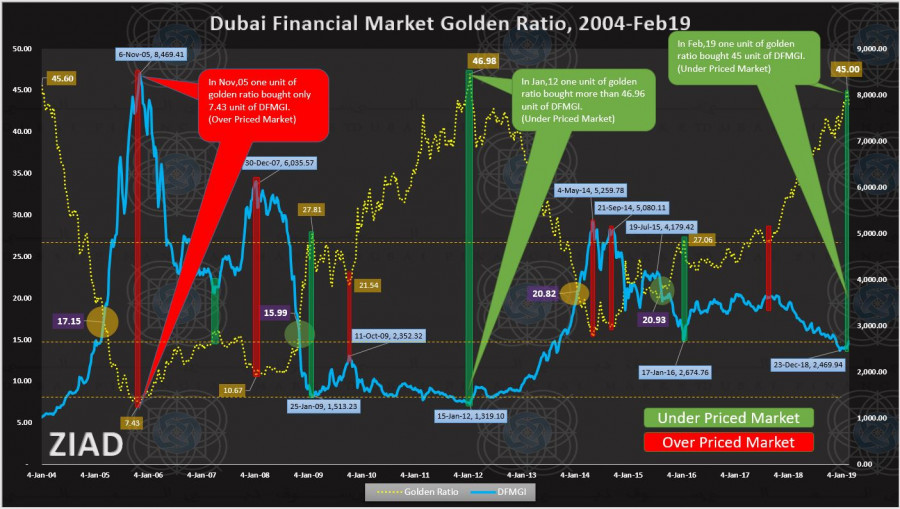
The graphic shown above may give us a visualization that may be the most clear about the levels of evaluation for the Dubai Financial Market, so we find, for example, that the Dubai Financial Market was considered within exaggerated price levels in November 2005 where it was 7.43 units From the index is sufficient to buy one unit of the golden percentage, and the situation was repeated in December 2017, and before the beginning of the market collapse due to the global crisis of 2008, the ratio reached 10.67 units. On the other hand, it was revealed to us during this indicator that the Dubai Financial Market had reached the condition of excessive selling or the market with a low rating under Priced Market in January 2012 where the golden ratio recorded a reading of approximately 47 units, meaning that we needed 47 units of the Dubai Market Index The purchase of one unit of the accumulated cumulative percentage of the selected indicators, which was indicative of an exaggerated decline of the market index. We also note the formation of 4 points of convergence between the two variables, which may serve as equilibrium points between them, Break even Point, indicating the presence of the market in the case of a neutral evaluation, and the golden ratio at those points coincided between 16 and 21 times on the approximation and was The index is then close to 3000-35 levels ...


UAE's Mubadala leads a $400 million financing round for German insurance company Wefox
Wefox, an insurance technology company founded by former emp.. Read more

Saudi Arabian Centers distributes dividends to shareholders for the second half of 2022 with a total of 356.25 million riyals
Arabian Centers Company has approved the distribution of cas.. Read more
The largest sovereign funds: "Abu Dhabi Investment Authority" advances to third place globally, with assets of $708.8 billion
The Abu Dhabi Investment Authority has advanced to the third.. Read more
Accumulated losses place Emirati companies on the "second category" screen, pending anonymity
Special Report - (Namazone): A group of companies listed.. Read more

Details 142 Saudi initiative to face the consequences of "Corona" B214 billion riyals
Special Report (Nmazzon): The government announced that.. Read more

Will gold remain a safe haven asset?
Gold has long been a source of controversy and contention am.. Read more
Global trade is expected to decline in the coming months
The economics department of Qatar National Bank (QNB) said t.. Read more

Analysis .. How will major central banks respond to the increasing cases of financial instability?
The global macroeconomic environment is experiencing some of.. Read more
The euro is below the dollar .. the lowest level in 20 years
For the first time in 20 years, the euro fell below $1 on Tu.. Read more
"OPEC"...The pressures of supply shortage will continue next year
OPEC expected global demand for oil to increase next year, b.. Read more
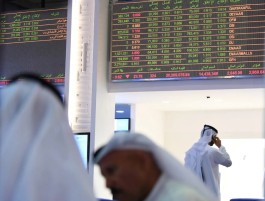
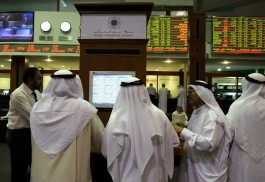
The golden ratio of the Dubai Financial Market Index

NamaaZone " The Power of Knowledge"

Analysis Service |
Its a free service for technical consultation provided by NamaaZone to the website visitors. |
Open account Request |
NamaaZone provides a range of integrated trading solutions in local and global financial markets |