


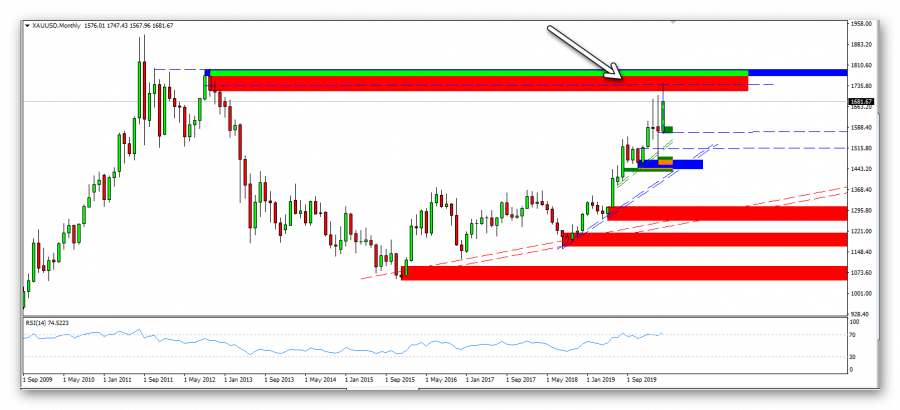


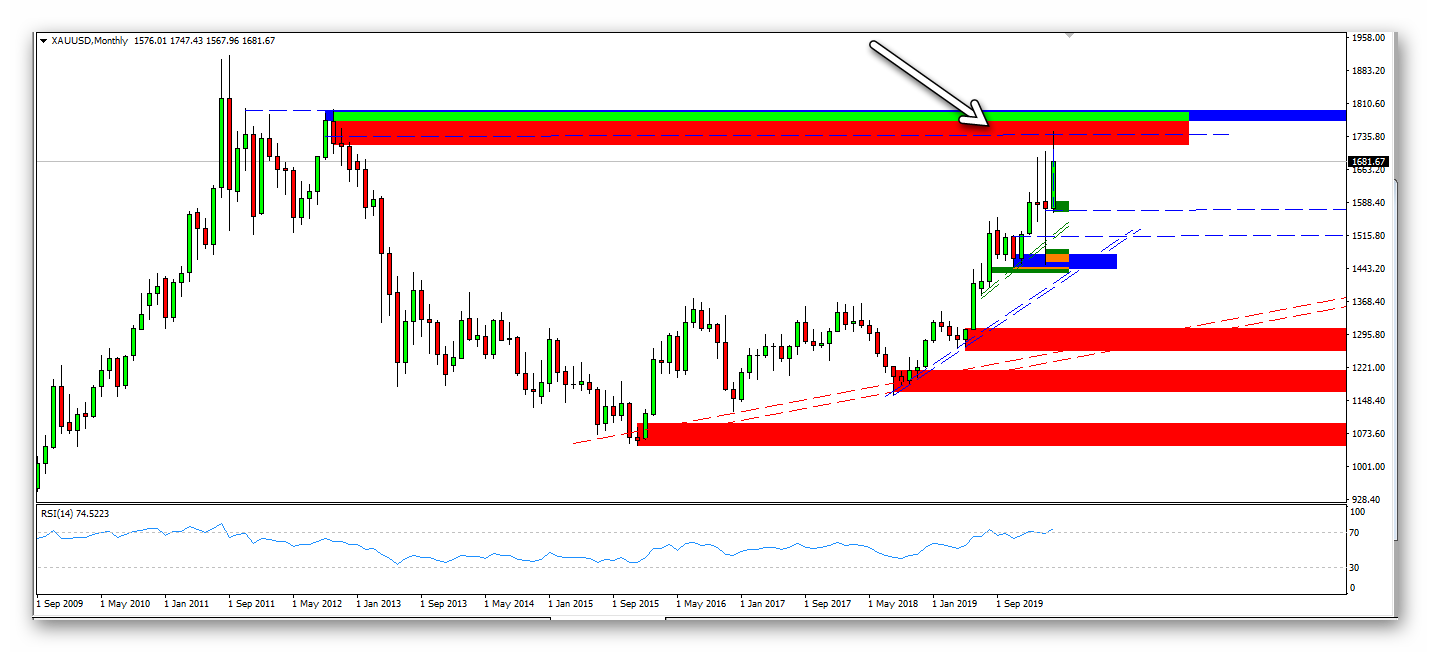
Gold is moving on the monthly frame as we see in a strong bullish trend since 2016 from 1075 levels until it reached 1745 levels which did not reach the year 2012
The candle wore the month with the buying climax candlestick pattern, and if it continues to drop, it will be an indication of the bullish calm.
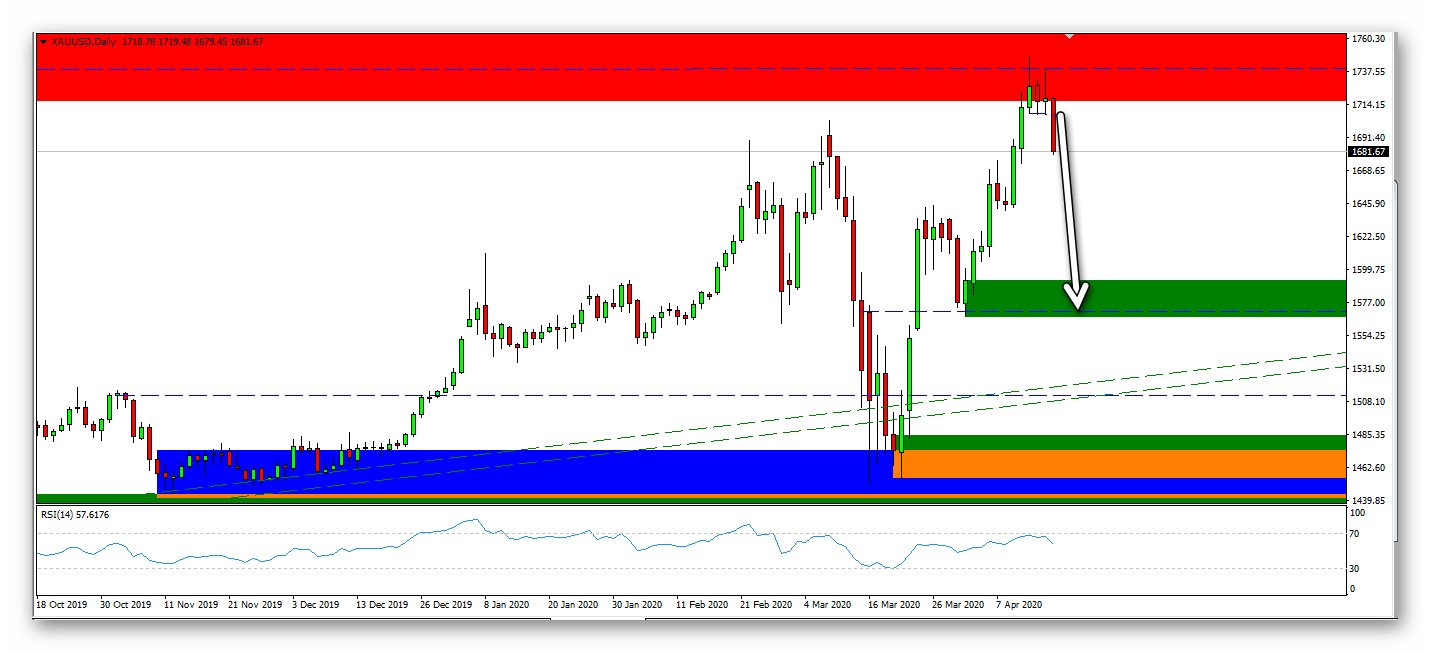
 On the daily frame, we find that the price grimaceed the rise of a candle last Tuesday in which the price reached the monthly levels with a saturation selling on the Momentum Index Relative Strength
The price is expected to drop to 1575 levels and then wait for the price behavior
The trading range is 1680-1700
The expected direction is down