





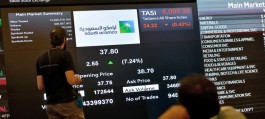





















Saudi Aramco's stock on the 5-hour chart is facing a crucial zone between 25.55 and 25.75 riyals, where bullish and bearish signals are intersecting sharply after a strong rejection at 26.04 riyals. The gap between the moving averages and the large volume at the peaks suggests that any upcoming breakout will strongly determine the next direction.
Alarm bell at the summit
Saudi Aramco's stock saw strong rejection at the SAR 26.04 level, coinciding with the formation of a bearish engulfing candlestick pattern, confirming high selling pressure. Current critical levels:
Dynamic Resistance (SuperTrend): 25.75 SAR
Medium-term support (SMA 50): 25.72
Minimum support level: 25.12 riyals
Conflicting trends are hindering progress.
Signs of an upward trend:
A bullish crossover was activated in the MACD indicator at 25.62 riyals.
The price is above the 20-period simple moving average (SMA 20) at 25.57 riyals, providing short-term dynamic support.
The ADX indicator shows a slight buying advantage, but momentum is weak.
Signs of decline:
The overall negative trend of the 50-day moving average remains dominant.
SuperTrend resistance just above the price; upper Bollinger Band rejection at 26.04 = failure to extend the upward range
Active bearish flag pattern with 80% probability around 25.60 riyals