


In the 1600s, the Japanese developed a method of technical analysis to analyse the price of rice contracts. This technique is called candlestick charting. Candlestick charts display the open, high, low, and closing prices in a format similar to a modern-day bar-chart, but in a manner that makes it easier to observe the relationship between the opening and closing prices. Each candlestick represents one period (e.g., day) of data.

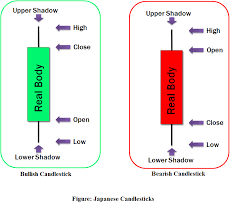
Candlesticks display the opening and closing prices as a solid body with the highs and lows as additional vertical lines. A clear distinction is made between up and down price moves. The body of an up move is shown as white and a down move as black.
 |
A candlestick showing a DOWNWARD MOVE - the closing price lower than the opening price |  |
A candlestick showing an UPWARD MOVE - the closing price higher than the opening price |
Interpretation
Candlestick charts dramatically illustrate changes in the underlying supply/demand lines.
It is obvious for example, that if a stock price moved far below its open but then rallied back into positive territory by the close of market, there is strong support for that stock. You would not obtain this information from looking at a simple line graph. A candlestick shows the movement during the day, and so at what price people were willing to buy or sell. As with a technical analysis, the interpretation of candlestick charts is based primarily on patterns, which have been observed over many centuries as to how they can be used to predict the price movement of a product. The most popular patterns are explained below
Bullish Patterns
 |
Long white (empty) line. This is a bullish line. It occurs when prices open near the low and close significantly higher near the period's high. |
 |
Hammer. This is a bullish line if it occurs after a significant downtrend. If the line occurs after a significant up-trend, it is called a Hanging Man. A Hammer is identified by a small real body (i.e., a small range between the open and closing prices) and a long lower shadow (i.e., the low is significantly lower than the open, high, and close). The body can be empty or filled-in. |
 |
Piercing line. This is a bullish pattern and the opposite of a dark cloud cover. The first line is a long black line and the second line is a long white line. The second line opens lower than the first line's low, but it closes more than halfway above the first line's real body. |
 |
Bullish engulfing lines. This pattern is strongly bullish if it occurs after a significant downtrend (i.e., it acts as a reversal pattern). It occurs when a small bearish (filled-in) line is engulfed by a large bullish (empty) line. |
 |
Morning star. This is a bullish pattern signifying a potential bottom. The star indicates a possible reversal and the bullish (empty) line confirms this. The star can be empty or filled-in. |
Bearish Patterns
 |
Long black (filled-in) line. This is a bearish line. It occurs when prices open near the high and close significantly lower near the period's low. |
 |
Hanging Man. These lines are bearish if they occur after a significant uptrend. If this pattern occurs after a significant downtrend, it is called a Hammer. They are identified by small real bodies (i.e., a small range between the open and closing prices) and a long lower shadow (i.e., the low was significantly lower than the open, high, and close). The bodies can be empty or filled-in. |
 |
Dark cloud cover. This is a bearish pattern. The pattern is more significant if the second line's body is below the center of the previous line's body (as illustrated). |
 |
Bearish engulfing lines. This pattern is strongly bearish if it occurs after a significant up-trend (i.e., it acts as a reversal pattern). It occurs when a small bullish (empty) line is engulfed by a large bearish (filled-in) line. |
 |
Evening star. This is a bearish pattern signifying a potential top. The star indicates a possible reversal and the bearish (filled-in) line confirms this. The star can be empty or filled-in. |
 |
Doji star. A star indicates a reversal and a doji indicates indecision. Thus, this pattern usually indicates a reversal following an indecisive period. You should wait for a confirmation (e.g., as in the evening star illustration) before trading a doji star. |
 |
Shooting star. This pattern suggests a minor reversal when it appears after a rally. The star's body must appear near the low price and the line should have a long upper shadow. |
Reversal Patterns
 |
Long-legged doji. This line often signifies a turning point. It occurs when the open and close are the same, and the range between the high and low is relatively large. |
 |
Dragon-fly doji. This line also signifies a turning point. It occurs when the open and close are the same, and the low is significantly lower than the open, high, and closing prices. |
 |
Gravestone doji. This line also signifies a turning point. It occurs when the open, close, and low are the same, and the high is significantly higher than the open, low, and closing prices. |
 |
Star. Stars indicate reversals. A star is a line with a small real body that occurs after a line with a much larger real body, where the real bodies do not overlap. The shadows may overlap. |
 |
Doji star. A star indicates a reversal and a doji indicates indecision. Thus, this pattern usually indicates a reversal following an indecisive period. You should wait for a confirmation (e.g., as in the evening star illustration) before trading a doji star. |
Neutral Patterns
 |
Spinning tops. These are neutral lines. They occur when the distance between the high and low, and the distance between the open and close, are relatively small. |
 |
Doji. This line implies indecision. The security opened and closed at the same price. These lines can appear in several different patterns. Double doji lines (two adjacent doji lines) imply that a forceful move will follow a breakout from the current indecision. |
 |
Harami (pregnant in English). This pattern indicates a decrease in momentum. It occurs when a line with a small body falls within the area of a larger body. In this example, a bullish (empty) line with a long body is followed by a weak bearish (filled-in) line. This implies a decrease in the bullish momentum. |