














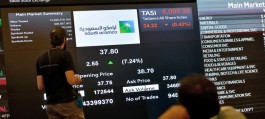
























The Saudi stock market index faces a crucial technical test today, Thursday, after closing at 10,957.13 points. It is approaching the 11,000-point mark, which has become a key resistance level around which several technical indicators are converging. Data from WarrenAI, available on the InvestingPro platform, reveals a clear narrowing of the index's range between accumulated resistance levels and shifting support levels, placing the market at a crossroads that could determine its future direction.
The index reached a high of 10,958.33 points during the session, coinciding with its approach to the 200-day moving average at 10,948 points, a level representing one of the most significant technical barriers to further gains. The convergence of this resistance with the psychological barrier at 11,000 points suggests that buyers are facing a double test zone that will be difficult to overcome without strong momentum and supportive trading volume.
Meanwhile, trading volume reached approximately 225.19 million shares, with activity declining during attempts to test resistance levels, which may reflect reduced buying appetite at current levels. This does not necessarily mean the uptrend is over, but it suggests that any new breakout needs stronger confirmation to avoid becoming a false breakout followed by a rapid pullback.
The technical situation becomes increasingly sensitive as the index approaches the 10,950-11,050 point range, which encompasses the 50% Fibonacci retracement level, the 200-day moving average, and the psychological barrier of 11,000 points. Therefore, the index's ability to stabilize above this range will be crucial in determining whether the market is poised to resume its upward momentum or if the correction is still ongoing.
11,000 points... the threshold that will determine the next battle
A specific reading shows that the index is still moving within a relatively narrow range, with an immediate support zone between 10,750 and 10,850 points. The significance of this zone is based on the convergence of several technical indicators, including the Ichimoku cloud, the 20- and 50-day moving averages, and the volume control point known as VPOC.
The area between 10,850 and 10,950 points appears more neutral from a technical perspective, due to the overlapping moving averages and the narrowing range. Therefore, this range currently offers no strong directional signal, making waiting for a clear breakout to one of its extremes more important than entering into random trades within the area.
On the upside, the main resistance zone starts at 10,950 points and extends to 11,050 points. This range gains strength from the convergence of the 200-day moving average with the 50% Fibonacci retracement level and the psychological resistance at 11,000 points.
This means that simply reaching 11,000 points is not enough to confirm a return to the upward trend. True strength will emerge if the index manages to break through and hold above this level, especially with improved trading volume. This would lend greater credibility to the breakout and reduce the likelihood of investors falling into a false rally trap.
Weak momentum increases the likelihood of fluctuations and corrections.
Among the key indicators currently being monitored by specialized analyses is the Average Directional Index (ADX) reading of 20.39, which suggests the absence of a strong and consistent trend in the market. This means the index may be in a consolidation or distribution phase, with a wait-and-see approach expected before a more decisive move emerges.
This situation coincides with a recent candlestick pattern that reflects clear hesitation near the resistance zone. This hesitation becomes more significant when it appears at higher levels, as the failure of buyers to push prices higher can be an early indication of a potential return of sellers.
The decline in trading volumes during resistance testing attempts further underscores the importance of this signal, as breakouts that are not accompanied by an expansion in activity are usually more likely to fail compared to breakouts supported by strong buying flows.
This highlights the potential for a buyer's trap near the 10,950-11,000 point range, where a temporary break above this level could attract further buying before the index falls back below the breakout zone. Therefore, monitoring closing prices and trading volume is more important than simply tracking the price reaching this level.
4 scenarios that chart the course for the index
Private data sets out several possible scenarios for the next move, depending on how the index handles key resistance and support levels.
In the aggressive buy scenario, the entry point is at 10,960 points after a daily close above the 200-day moving average, with a stop-loss at 10,850 points. The trade targets levels of 11,175, 11,400, and 11,780 points, with risk/reward ratios of approximately 1.95, 4.00, and 7.45 respectively, and a moderate confidence level. This scenario is aimed at traders seeking breakout opportunities.
The conservative buying scenario relies on the index reaching 11,020 points after breaking through 11,000 points, then retesting and holding that level as support. The stop-loss remains at 10,850 points, while the trade targets the same levels at 11,175, 11,400, and 11,780 points. This scenario provides further confirmation for investors who prefer to wait for a successful breakout before entering a position.
Conversely, the aggressive sell scenario involves entering a trade at 10,940 points if a clear rejection of resistance occurs, with a stop-loss at 11,050 points. Targets are 10,700, 10,500, and 10,200 points, with risk-reward ratios of approximately 2.18, 4.00, and 6.72, and a moderate confidence level. This scenario targets traders who are banking on the likelihood of a continued correction.
The conservative sell scenario requires a daily close below the 20-day moving average at the 10,800-point level, providing further confirmation of the downward momentum shift. The stop-loss remains at 11,050 points, while the targets remain at 10,700, 10,500, and 10,200 points.
Risk management becomes crucial in testing areas.
After reaching the next target, the movement can be tracked using dynamic moving averages, allowing the trader to take advantage of the continuation of the trend instead of exiting the trade prematurely.
In the bullish scenario, the 10,850-point area remains a crucial threshold for risk management, while 11,050 points represents a critical level for invalidating the bearish scenario. Therefore, dealing with the index depends not only on predicting its direction but also on knowing the level at which that prediction becomes invalid.
This methodology is particularly important in markets that move within narrow ranges, because trading without a clear determination of the scenario's invalidation point may lead to greater losses in the event of a sudden breakout or rapid reversal.
WarrenAI transforms market data into a map of opportunities and risks.
Instead of tracking moving averages, Fibonacci levels, trading volume, and trend indicators separately, analytical tools allow the investor to build a comprehensive view of support and resistance zones, potential entry points, stop-loss levels, targets, and risk-reward ratios.
These capabilities help to shorten a large part of the time that may be spent manually analyzing the index, especially for an investor who is monitoring a large number of stocks, sectors and markets at the same time.
What does breaking through 11,000 points mean for the Saudi market?
If the index manages to break above 11,000 points and then maintains trading above the 11,020-point level after retesting it, the technical picture could gradually shift in favor of buyers. In this case, 11,175 points would become the first target, followed by 11,400 points, and then 11,780 points if the momentum continues.
However, if the index fails to break above the 10,950-11,050 point range, coupled with continued weak trading volume, it could bring renewed pressure back to support levels. A break below 10,850 points would be even more significant in this scenario, as it could signal the market transitioning from a consolidation phase to a broader correction.
Trading between 10,850 and 10,950 points remains the least clear directionally, so waiting may be more effective than trying to catch short moves within a narrow range.
Thus, the Saudi general index faces a phase requiring greater discipline, as the picture remains open to either a resumption of the upward trend or a renewed correction. Trading volume and price action around 11,000 points will be crucial factors in determining which scenario prevails.