


Trend lines or trends are one of the most common and widely used technical analysis methods.
And I'll try to explain it in a simple and easy way to make the most of it.
Trend lines are support and resistance levels, but they are not stable, so when the price takes a direction, these lines give good entry opportunities as the price changes up or down.
The trend line is negotiable after touching the left hand for the third time so that it is confirmed as a moving support
Now we take examples so that we can understand more.
Example 1
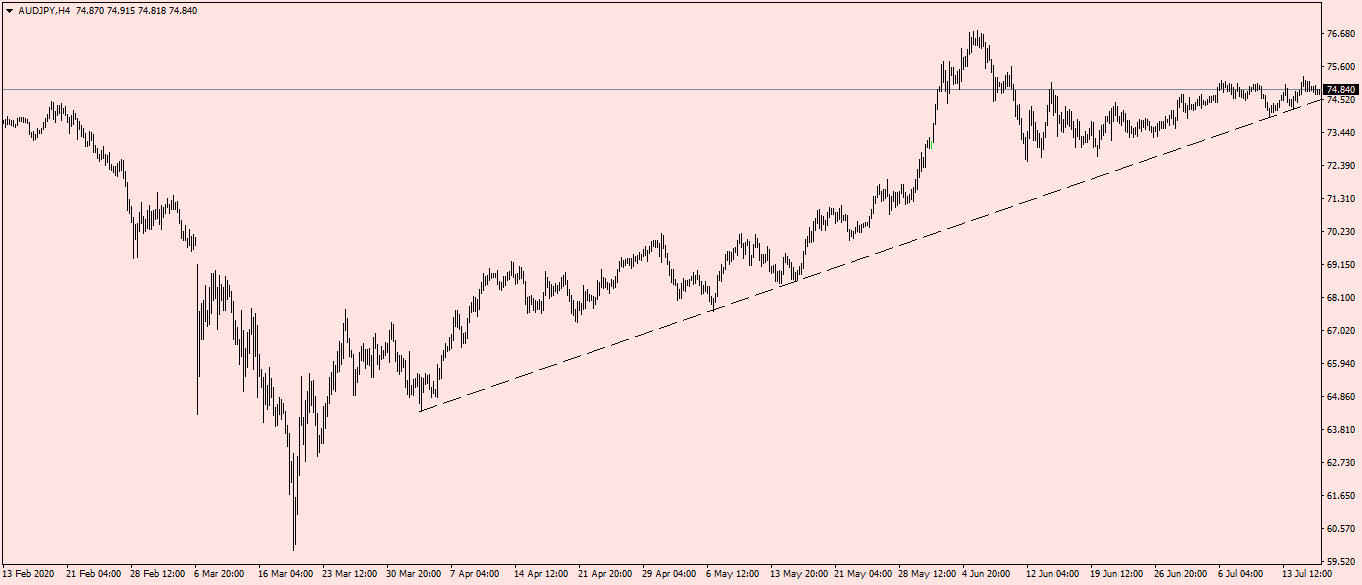
A pair of Australian Yen on the four-hour frame and a bullish trend line and every time the price touches the trend line it is a good opportunity to enter into long positions
The stop loss is below the trend line and profit taking is at the nearest peak or price resistance
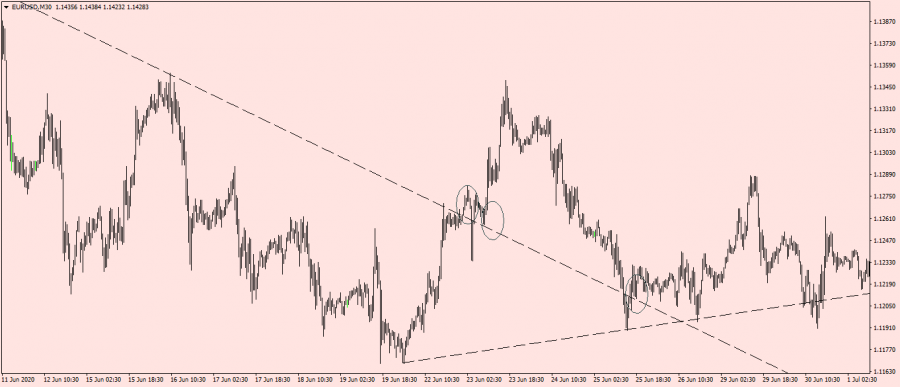
Example 2 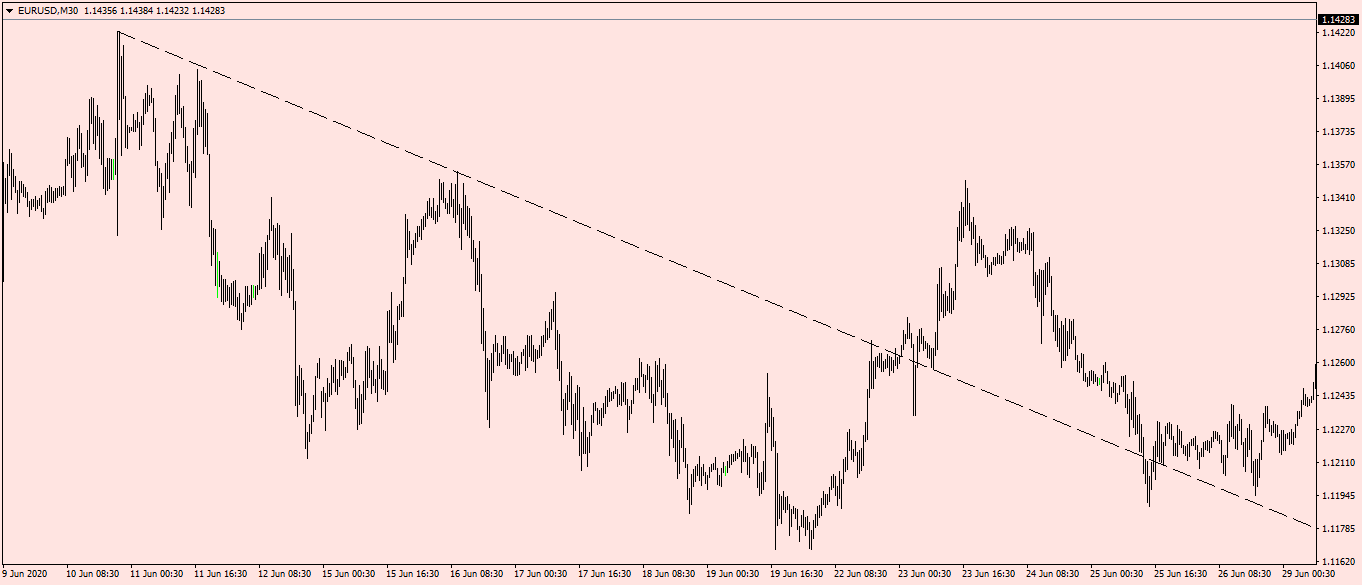 EURUSD, the half-hour frame, a falling trend line, and every time the price touches the line, it heads down
Sell and stop loss deals will be above the trend and take profit at the nearest bottom or support
Example 3
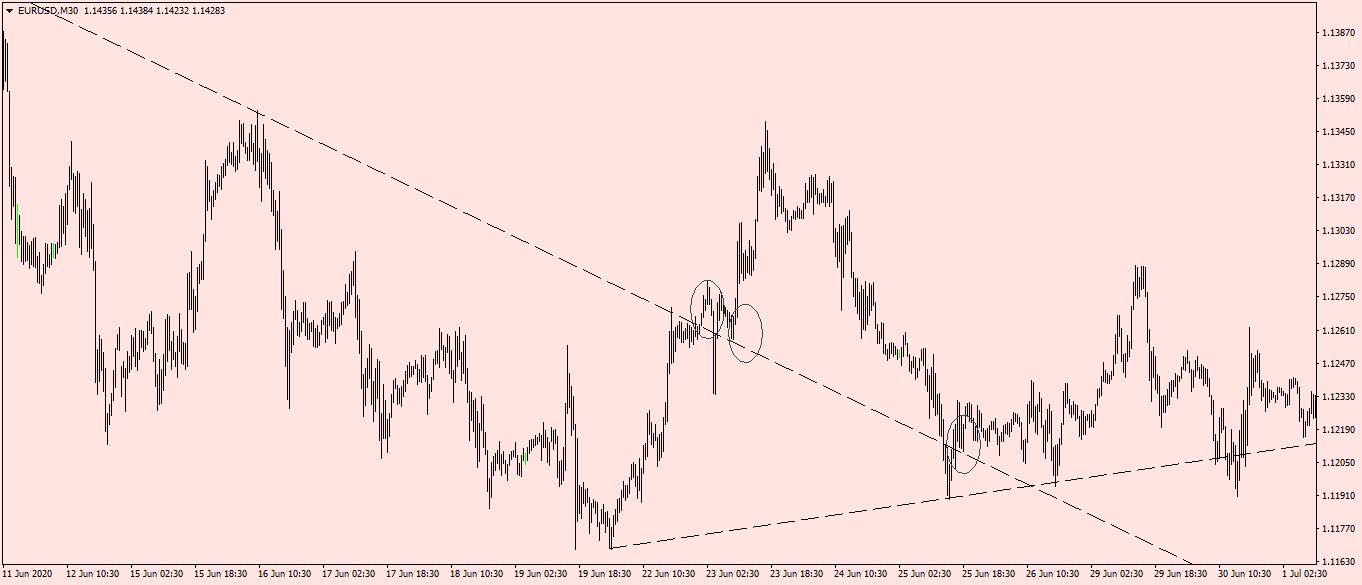 Continuing with the previous example, we take the idea of breaking the trend as a useful way to know the trend change.
When the trend is breached, it will change from a bullish to a bearish, and vice versa
When the price here broke the trend line up, the trend changed and became an opportunity to enter long positions
Either from direct fracture or from re-testing, as we see on the shown circuits.
We also see the formation of another bullish trend line after the breached downward movement to confirm the change of trend

UAE's Mubadala leads a $400 million financing round for German insurance company Wefox
Wefox, an insurance technology company founded by former emp.. Read more

Saudi Arabian Centers distributes dividends to shareholders for the second half of 2022 with a total of 356.25 million riyals
Arabian Centers Company has approved the distribution of cas.. Read more

The largest sovereign funds: "Abu Dhabi Investment Authority" advances to third place globally, with assets of $708.8 billion
The Abu Dhabi Investment Authority has advanced to the third.. Read more
Accumulated losses place Emirati companies on the "second category" screen, pending anonymity
Special Report - (Namazone): A group of companies listed.. Read more

Details 142 Saudi initiative to face the consequences of "Corona" B214 billion riyals
Special Report (Nmazzon): The government announced that.. Read more

Will gold remain a safe haven asset?
Gold has long been a source of controversy and contention am.. Read more
Global trade is expected to decline in the coming months
The economics department of Qatar National Bank (QNB) said t.. Read more

Analysis .. How will major central banks respond to the increasing cases of financial instability?
The global macroeconomic environment is experiencing some of.. Read more
The euro is below the dollar .. the lowest level in 20 years
For the first time in 20 years, the euro fell below $1 on Tu.. Read more

"OPEC"...The pressures of supply shortage will continue next year
OPEC expected global demand for oil to increase next year, b.. Read more
How to take advantage of trend lines

NamaaZone " The Power of Knowledge"

Analysis Service |
Its a free service for technical consultation provided by NamaaZone to the website visitors. |
Open account Request |
NamaaZone provides a range of integrated trading solutions in local and global financial markets |