


The Saudi Tadawul All Share Index (TASI) is currently trading at 10,538.2 points, after a short rebound from its lowest annual levels. However, the overall picture is still strongly inclined towards a downward trend, with sellers clearly dominating the technical landscape.
This rebound came after a sharp sell-off that began with the breaking of the main trading range between 10,900 and 11,500 points, a break that changed the short- and medium-term technical structure and returned the index to a clearly defined downward trajectory.
The data reflects an accurate picture of this shift, with technical indicators collectively showing a clear advantage for the negative scenario, with warnings of the potential formation of an upward trap between 10,700 and 10,900 points.
Don't let false rebounds in the Saudi market cause you to miss golden investment opportunities. Subscribe today to Investing Pro Arabic with a discount of up to 50% for a limited time, and get a comprehensive system that allows you to navigate confidently in a market characterized by correction.
A weak rebound amid a strong downtrend
The Relative Strength Index (RSI) is registering a reading of 30.72, which is an oversold area that often supports a short-term rebound, but this signal alone is not enough to declare the end of the downtrend.
A hammer candlestick pattern formed at the 10193.8 level on 01/03/2026, indicating the absorption of selling pressures and the beginning of a technical rebound, but this rebound is still within a corrective framework within a larger downward trend.
In the session of 03/03/2026, a bullish Marubozu candle appeared at 10538.2 points, but the trading volume was below average, which reduces the credibility of the bullish movement and indicates the absence of strong institutional participation.
Negative confirmations from advanced indicators
The SuperTrend indicator is showing in red at 10893.1 points, confirming the continuation of the downward trend unless it closes above this level with strong signals.
The price is also trading below the Ichimoku cloud, reflecting continued negative pressure and reinforcing the idea that any current uptrend is a bounce within a downtrend rather than a change in direction.
The ADX indicator is recording a reading of 33.6 with a clear superiority of the -DI indicator over the +DI, indicating an acceleration in the downward momentum, and confirming that the current trend is not sideways but is supported by considerable momentum.
Critical resistance zones and the risk of an upward trap
Strong technical resistances are concentrated between 10690 and 10900 points, including Fibonacci levels at 38.2% in addition to previous peaks, making this area a candidate for the emergence of new selling pressures.
According to the conservative bearish scenario, the 10750 level may be seen as a possible entry point for selling in the event of a bearish reversal candle, with a stop loss at 10950 and targets at 10250 and then 10000 points, with an attractive risk-reward ratio.
The alternative upward scenario remains conditional on a daily close above 10893.1 with high trading volume, targeting 11480 and then 11780 points, however, the degree of confidence in this path remains weak compared to the basic scenario.
Neutral zone and high volatility
The area between 10,300 and 10,680 points is a highly volatile range, where technical signals overlap and the clarity of opportunities diminishes, making abstention from trading a logical option for conservative traders.
Currently, ideal buying zones are not appearing, given the weak expected return compared to the risk, especially since the current rebound is moving against the general trend.
Impact of regional factors on the market
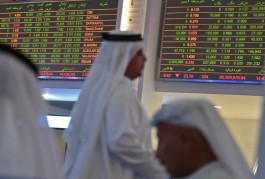
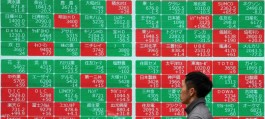
Gulf markets came under strong pressure on 01/03/2026 following the Iranian attacks, with the Tadawul All Share Index (TASI) closing down 2.2%, a direct reflection of the market's sensitivity to geopolitical tensions.
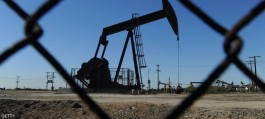
Banks led the decline, with Al Rajhi Bank falling by 3.4% and the National Bank of Saudi Arabia by 4%, while Aramco shares limited losses by rising by 3.4%, supported by rising oil prices.
These developments illustrate that the negative technical structure intersects with a turbulent external environment, increasing the likelihood of continued volatility in the coming period.
Summary of the art scene
The downward trend remains dominant on the Saudi general index, despite the recent technical rebound, with the possibility of an upward trap forming if traders rush to buy near resistance areas without a real confirmation of a change in trend.
Technical indicators show that every current rise is a potential opportunity for a sell repositioning at clear resistance levels, until proven otherwise by strong reversal signals supported by high trading volumes.